Introduction
Debugging is a fundamental process in programming. Most of us already know what debugging is, if you are not, It is the process of identifying and removing bugs or errors in your program.
The first step one takes to fix such bugs is to analyse errors in the code. This is mostly to understand where the program went wrong. Syntax errors are usually indicated by the compiler or IDE during development, however, runtime errors on the other hand present more complex challenges.
How do you fix this error easily and quickly?
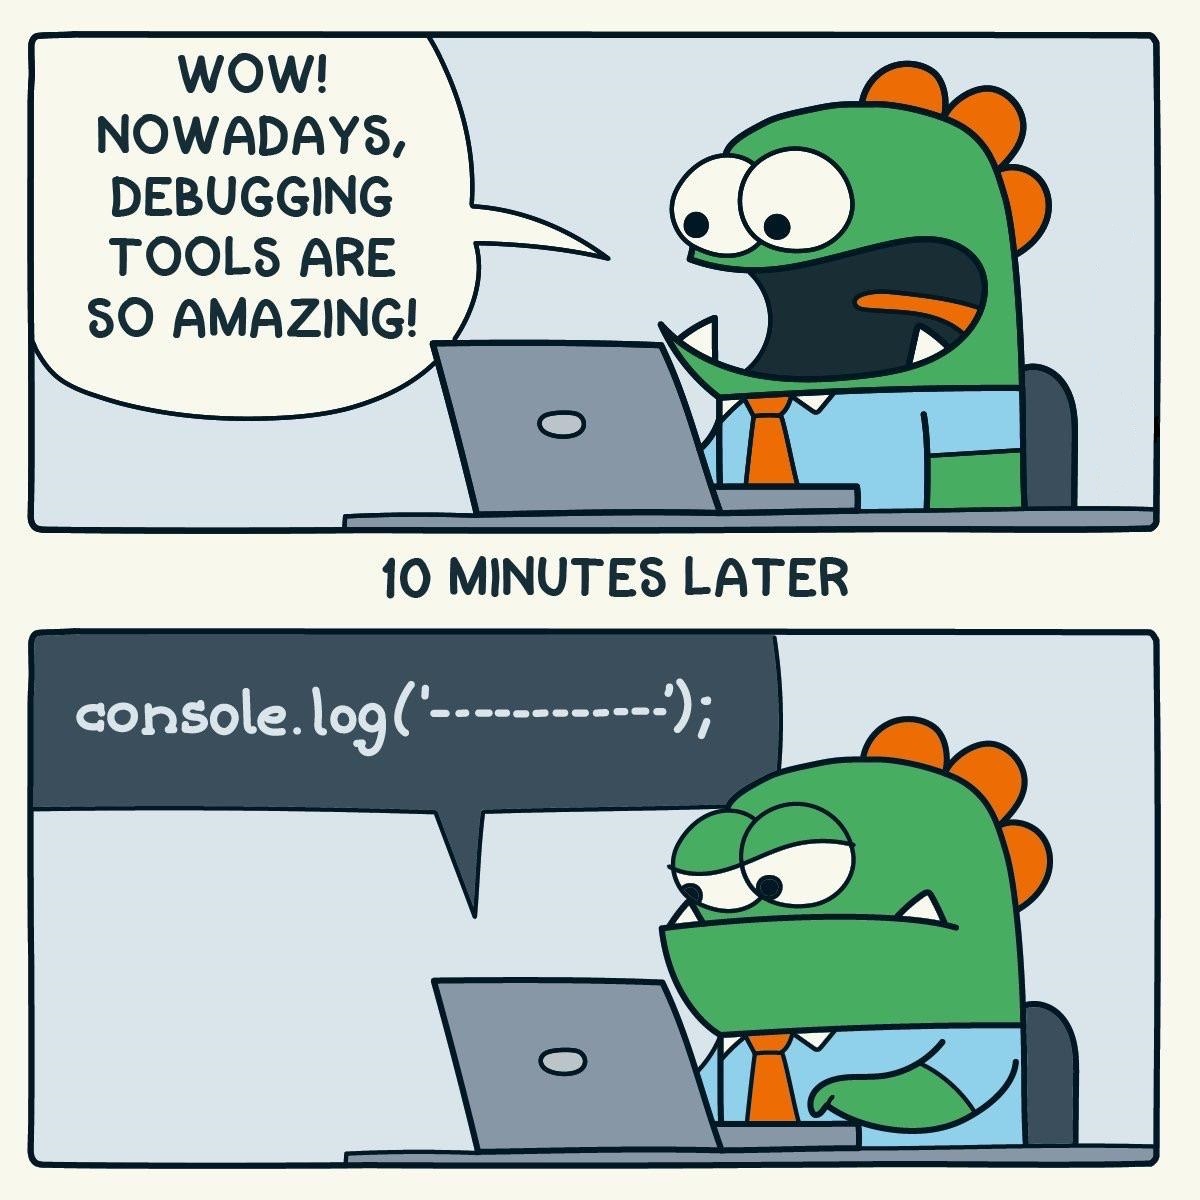
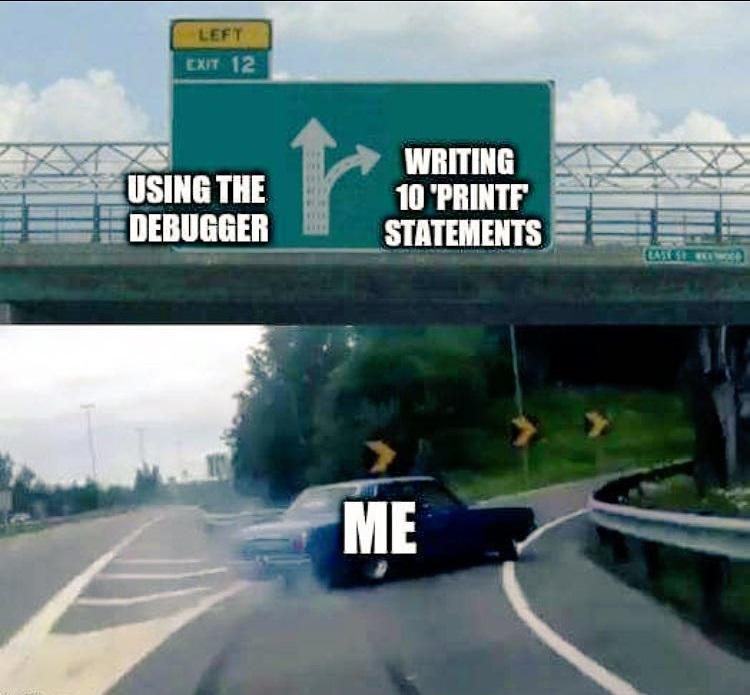
“Caveman Debugging” is the process of adding print statements at certain positions of the code to understand the exact flow of the program and how it works or where it went wrong.
Sure, one can manually try and find errors within the code. But how long does that take? Especially if the code is large. Using print statements you can quickly and effectively identify where the code went wrong and fix it. It is give or take, a simple divide and conquer approach at debugging. It saves a lot of time.
How do I use this debugging method?

This is not a high-end, top quality debugging method for anyone to find it hard to understand, much rather hard to use.
The most basic use of the Caveman debugging method is to find out the exact value of a variable or if the values are even being assigned in the first place.
For example, I recently had a problem where a function did not return any value. I managed to debug this in under 5 minutes by simply using a print statement to check where the function went wrong and how the values changed.
Sometimes when you are working on a very long program, more specifically a large function or method and you are not sure where the code went wrong or if some of those lines are even being executed, the easiest solution would be to add a few print statements along the flow of the code to understand where exactly the error arises and what went wrong.
But aren’t there better alternatives?


Using print statements can be useful and easy, but is it effective? Compared to tools available, the answer will have to a
NO.
So what are these alternatives? Well, most experienced developers prefer using logging or tracing frameworks. Modern IDEs often come equipped with powerful built-in debuggers. Personally, I use VSCode, which offers features like breakpoints, logpoints, and data inspection to understand variable values more comprehensively.
And it’s really not that hard to pick up, learn, and start using. It can be as simple as adding a breakpoint with one click and then monitoring values in the debugger. This makes debugging a lot more robust and efficient.

Conclusion
While modern debugging tools offer robust solutions, the caveman debugging method remains a straightforward and effective approach for quickly identifying and fixing code errors. As developers, mastering both traditional methods and advanced tools will help us resolve bugs efficiently. We might not always have access to a debugger (competitive coding ;-;), so knowing how to approach a problem headfirst is crucial. And that’s when caveman debugging really shines.
